# Our Process
Welcome to the official documentation of the development process of Horizon.
Horizon was build on the basis of two processes:
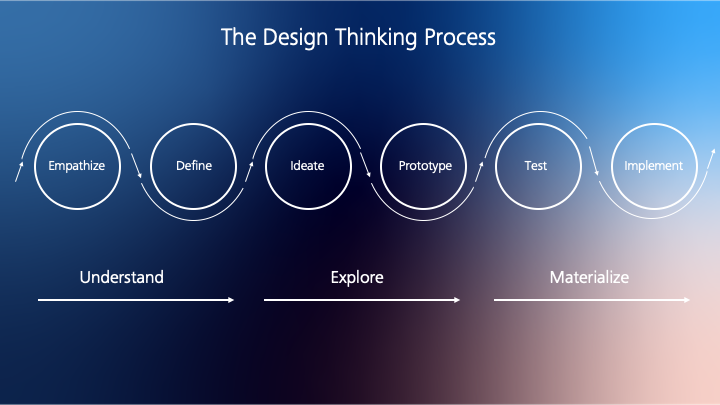
- The Design Thinking Process
- The Data Driven Decision Making Process / Cross-industry standard process for data mining
Both processes where necessary to not only work with the data, but also ideate and develop ideas for the frontend. The Cross-industry standard process for data mining is separated in 6 steps - the first step is included in this page, the second step can be found in the Data Source section.
However, this project has went through many more stages than are found in a typical data science / data mining process, mainly due to the data streaming nature of Horizon. The documentation is therefore enriched with ideas and results from the design thinking process as well as a description of other steps that were part of the project.
In the conclusion, we give a resume of what we learned, difficulties and challenges we faced and how Horizon could be further improved.
# Design Thinking
Following is the description of the first stage inside the CRISP-DM process model. The second step follows in the description of the Data Source.
# Empathize and Define: Understanding the Scope
Responsible: Jan Anders, Felix Bieswanger, Sebastian Hermann, David Rundel & Anja Stütz
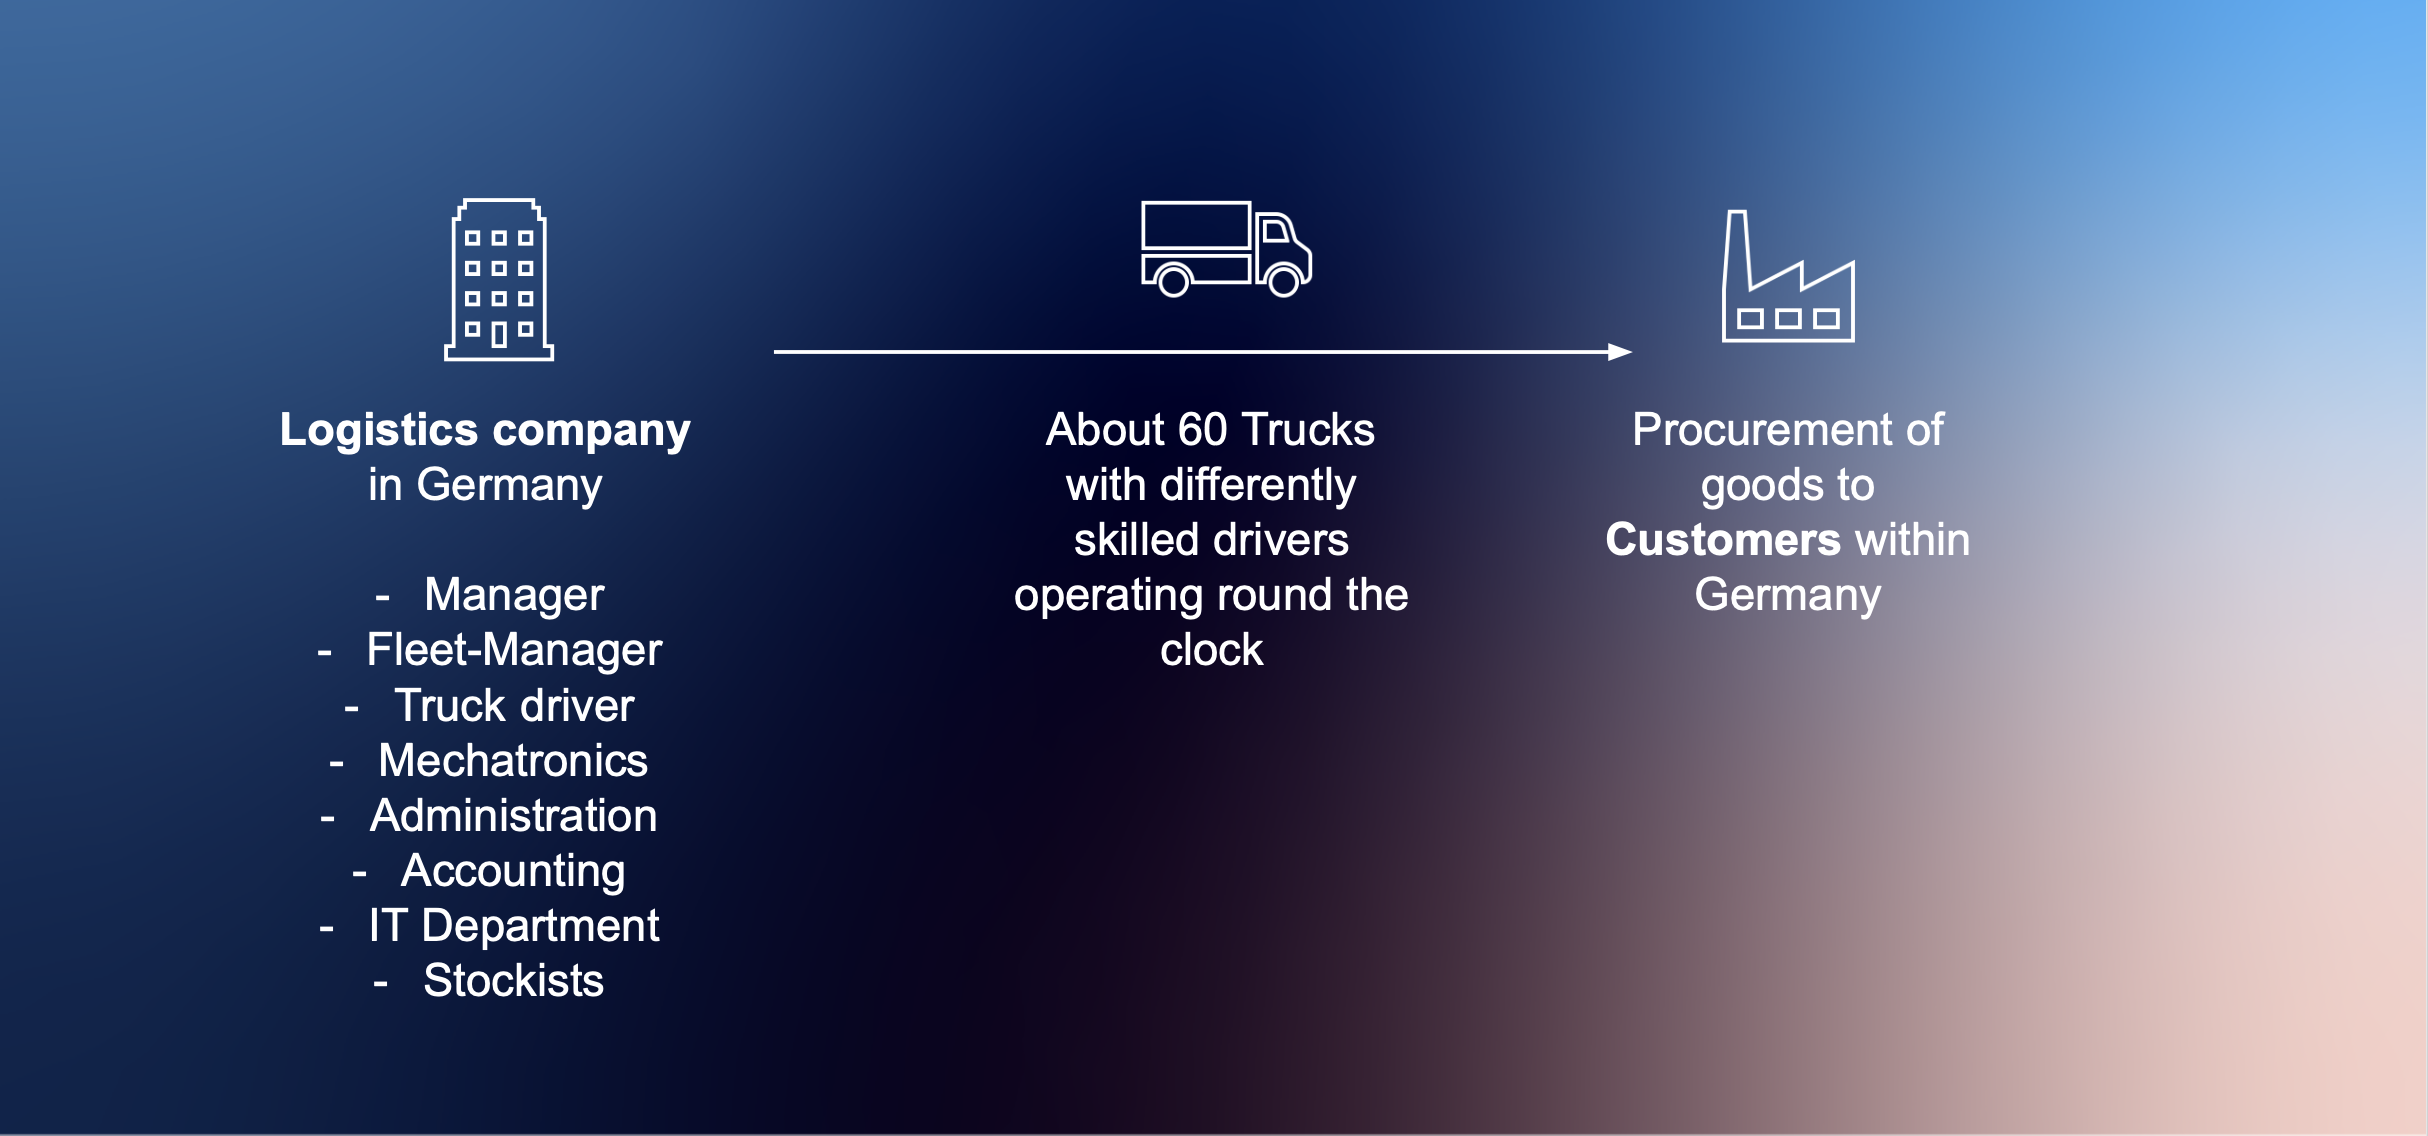
Horizon is a student project based on predefinied tasks. The main goal is to optimize the costs of truck fleets by data analysis and a dashboard. In order to work as realistically as possible, the task was seen as the assignment of a fictional company. Accordingly, we as a group find ourselves in the role of the consultants who develop a product for this company.
Current situation at the fleet enterprise
The existing communication in the company provides for a driver to report current events to a fleet managers who will respond with instructions.

In the past, the fleet manager had only little overview of the current position and situation of the trucks. A newly introduced telemetry module (represented by a simulation in the project) in the trucks now allows the transmission of important information about the position and situation of the truck to the office. However, until now the control center can hardly do anything with this information and therefore needs a suitable dashboard and data modeling.
# Task
The following predefined Tasks were given:
- Dashboard design for data visualization after expansion of an existing database with two options:
- Option 1: Batch analysis and creation of a dashboard for the user "fleet management" as well as selection and application of a DM clustering algorithm
- Option 2: Real-time analysis and creation of a dashboard for the users "fleet management" and "drivers" (indirect) as well as selection and application for real-time visual monitoring
To fit the scope and the predefined use-case of the fleet enterprise, option two was chosen.
"Real-time analysis and creation of a dashboard for the users "fleet management" and "drivers" (indirect) as well as selection and application for visual monitoring in real time".
The following objectives were to be pursued:
- Adjustment of the parameters for realistic simulation
- Visualization of the data
- Derivation of recommendations for action from visualized data
# Understanding the Scope and Research
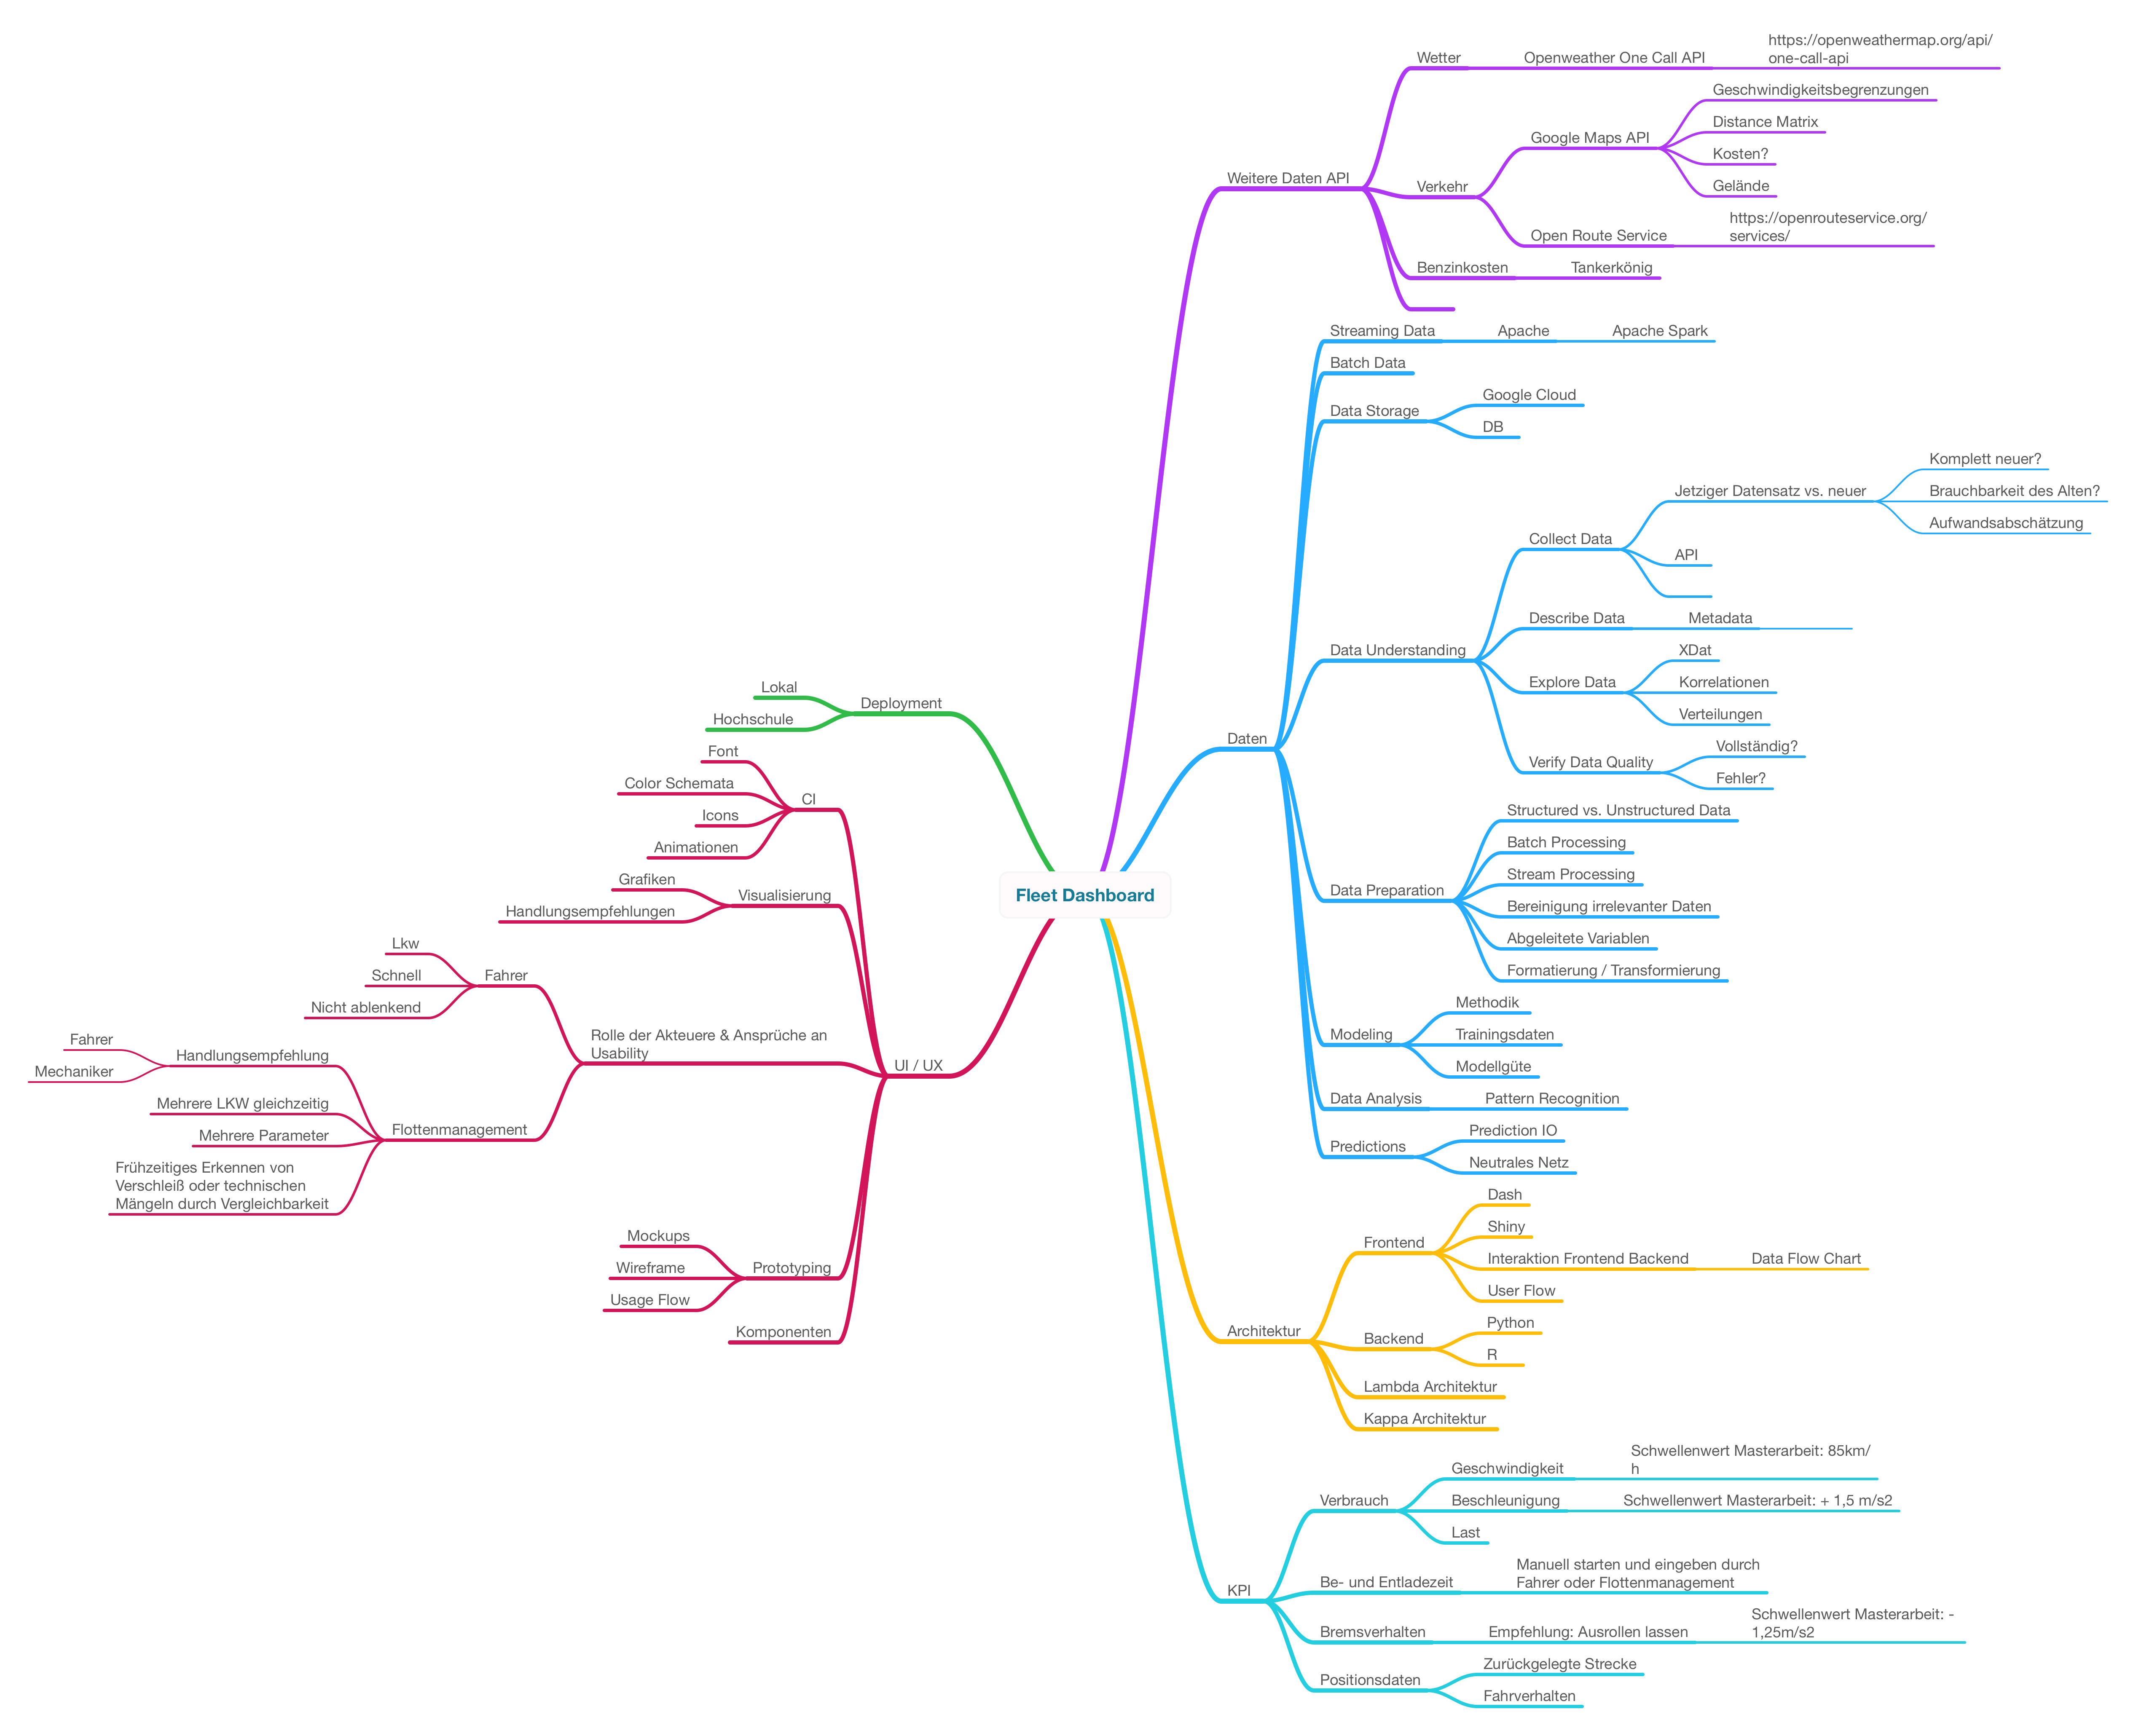
In order to understand the scope of the project and to bring all team members up to the same level, design thinking methods were applied first. Brainstorming was chosen as the first method to get a first impression. The results are presented below. The brainstorming was created on the topic of fleet management and trucks as well as for dashboards in this area.
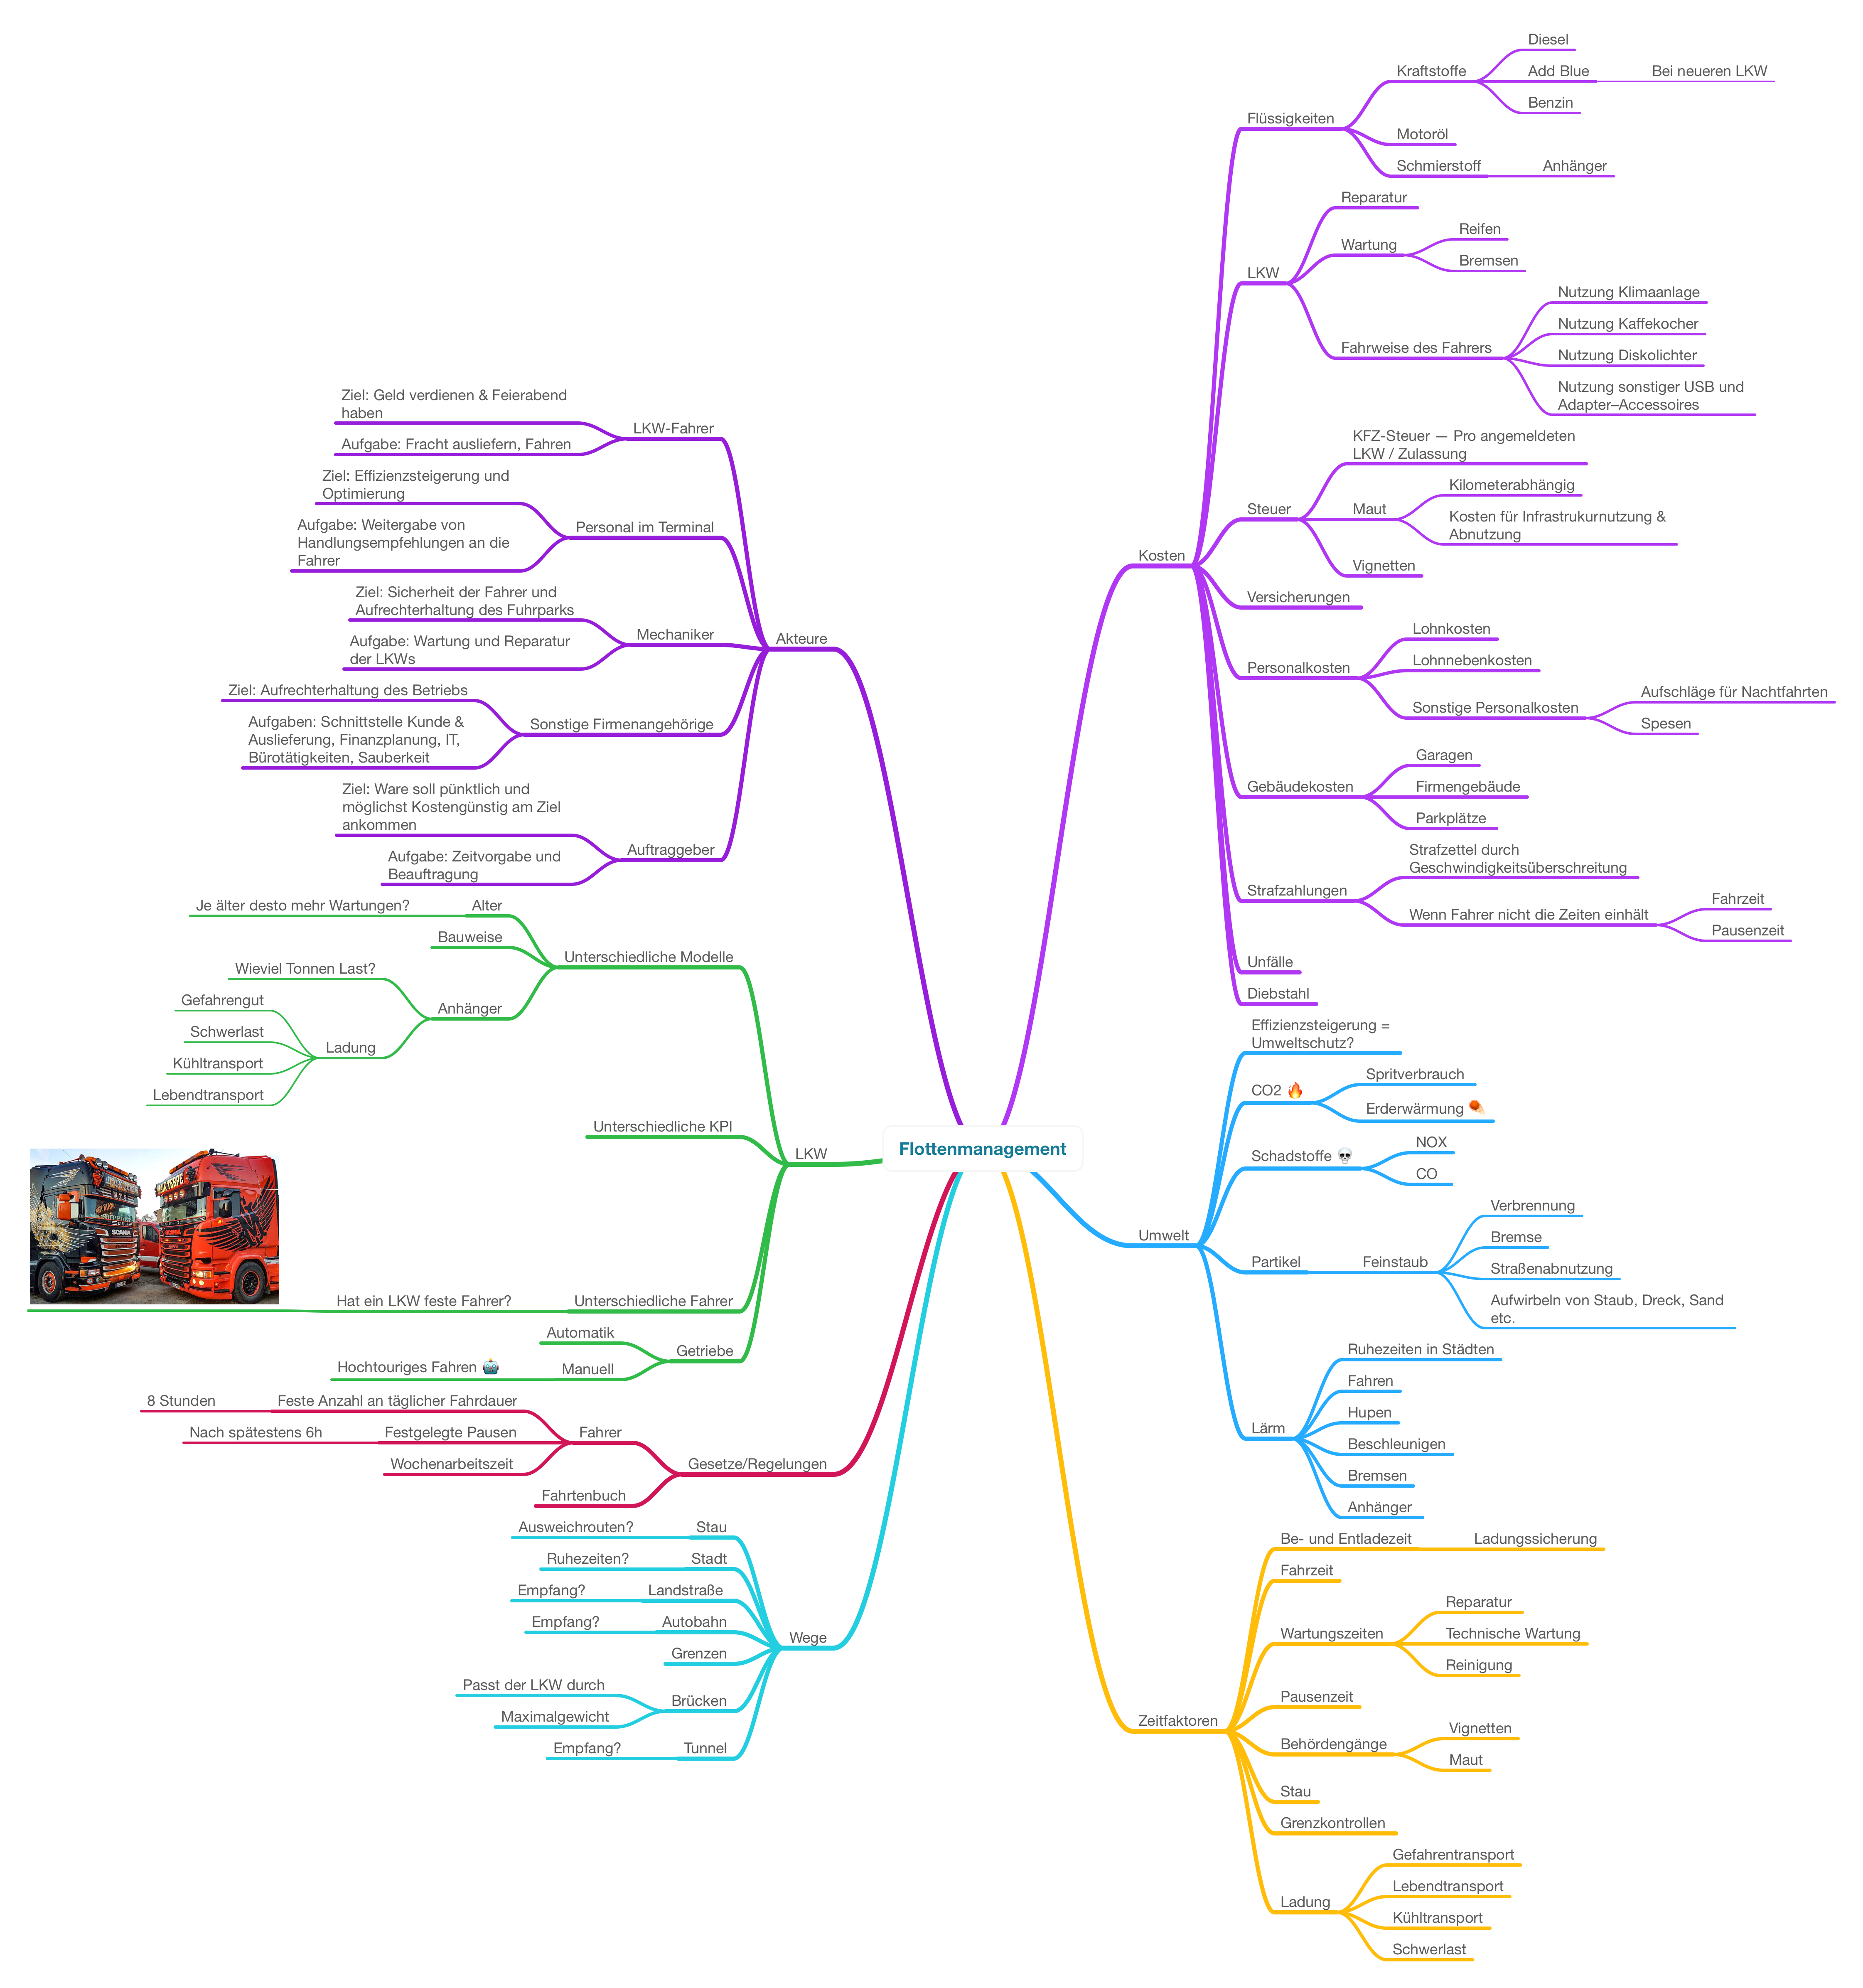
Based on the results of the brainstorming an extensive literature research was conducted. The results are listed and cited at the appropriate place in the description of the simulation.
In addition to the literature research, competing products were also considered and analysed.
# Current state of the market
To understand the current state of the art other fleet management products were evaluated.
| Product | Website | Some of the Services |
|---|---|---|
| Carano Software Solutions | Access Website | Data handling and management; Cost management and controlling; Dashboards as well as Fuel data management |
| VIMCAR Fleet | Access Website | Cost management and comparison; Fuel data management; Recommendations for cost efficency; Hint for irregulatories |
| TRIBMLE | Access Website | Flexible KPI; Driver comparisons and analysis of the driver; Consumption; Coach Assistant for recommendations; Onboard Driver Scorecard |
# Stakeholders
To understand the requirements of a fleet-management dashboard better, different stakeholders were considerd.
| Narrow Stakeholders | Tasks | Goals & Interests |
|---|---|---|
| Manager | Management of the enterprise; Specifies KPI and targets | High profit; Cost reduction; Satisfied customers; Fast and efficient deliveries and processes; Hates: Unnecessary costs and dissatisfied customers |
| Truck Driver | Drives the trucks; Monitors loading and unloading | Delivering goods successfully and safely, Hates: Incidents |
| Fleet-Manager | Monitors truck movements and KPI; controls and coordinates; gives recommendations for action | Getting trucks to their destination efficiently and cost-savingly |
| Broad Stakeholders | Tasks | Goals & Interests |
|---|---|---|
| Controlling | Monitors finances and budget; Takes care of orders | Save money; Highest possible profits for the company |
| Mechanic | Fleet maintenance; Maintenance and repair | Safe and functional trucks |
| Customer | Gives orders and money | On-time and safe delivery; Damage free delivery; Cheap delivery |
| Legislator | Specifies working conditions and requirements for trucks and companies | Respect for workers' rights; respect for rights for the benefit of the State, society and other road users |
| Environment | Clear air, compliance with environmental zones and legal regulations | Minimization of fine dust, particles and other pollutants |
# Personas
Besides the client, the head of the company, the main users, the fleet managers, and the drivers are the direct stakeholders. Due to their importance for the project, personas have been created for the latter to identify their motives and requirements.
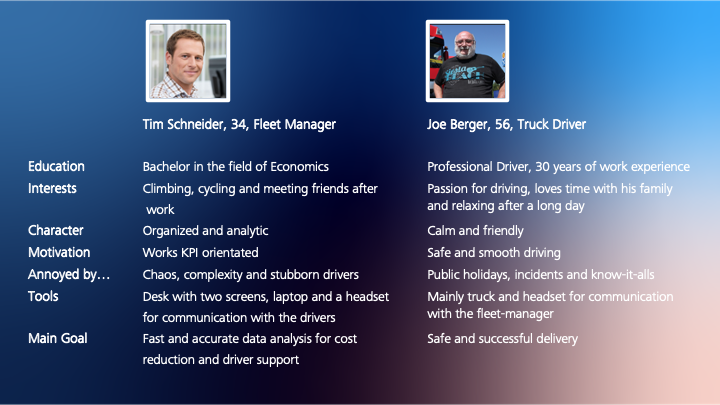
Source of the Fleet-Manager image
Source of the Truck Driver image
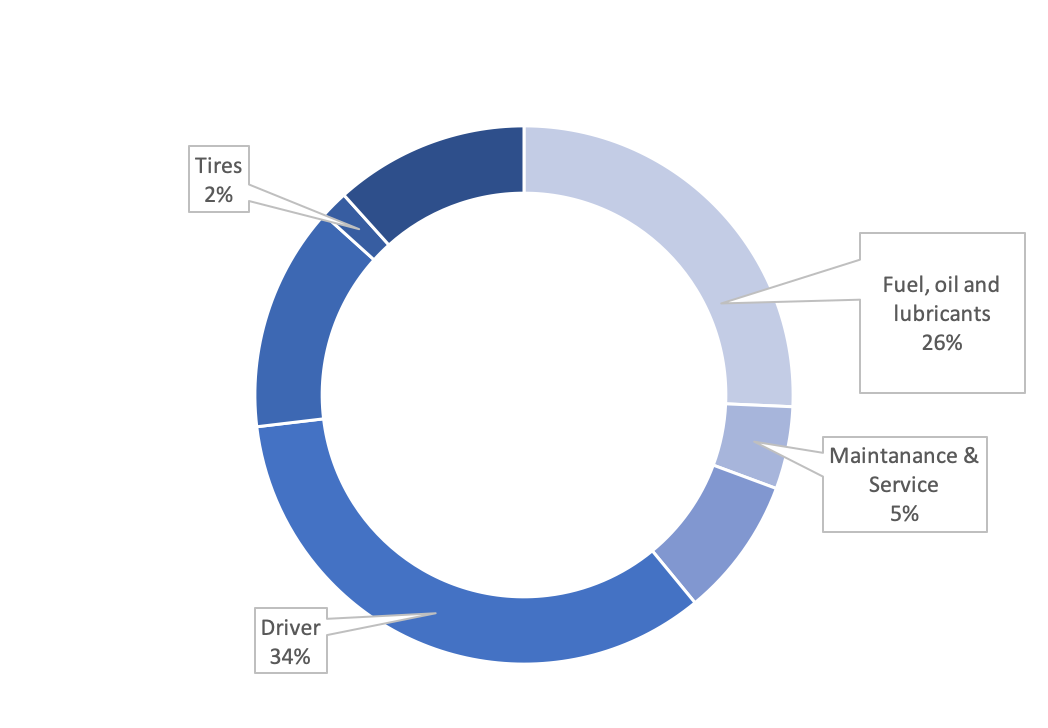
Determine Data Mining Goals (Data Mining Goals and Success Criteria)
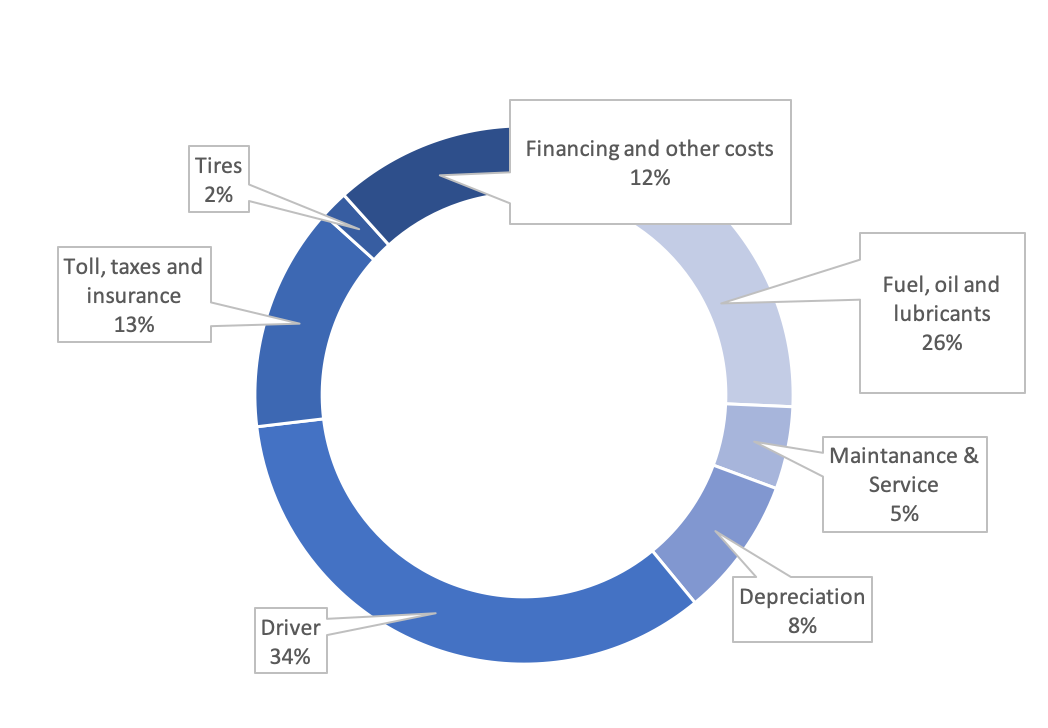
From all the different costs, the following four cost items are particulary relevant for further development, because they can be positively influenced, resulting in either direct or indirect cost savings.
Indirect cost savings
- The Driver
Drivers are essential for the company. Nevertheless, it is possible to optimize the drivers and thus make savings elsewhere. With the help of instructions from the Fleet Manager, the driver's driving style can be improved and costs in other areas such as fuel consumption can be achieved. A fleet manager can also use the dashboard to detect technical problems at an early stage and pass them on to the driver. The driver is sensitized to this and in the future can even recognize the warning signs of technical problems at an early stage: „Erkennt der Fahrer die Warnzeichen nicht rechtzeitig, droht ein Platzer des Turboladers“ (ADAC, 2016)
Direct cost savings
- Maintanance and Service Costs
Cost savings through extended maintenance and repair intervals are not recommended, otherwise damage to the motor or other engine components may occur. As a result, accidents with possible personal injury and higher costs are possible (cf. ADAC,2016). This can also be minimized by displaying the technical status in the dashboard and allowing an early detection of major technical problems and negative aftereffects. At the same time, the dashboard can be used to remind the driver of regular maintenance and repair intervals.
- Costs for fuel, oil and other lubricants
The costs for fuel, oil and lubricants are highly variable and depend on a wide range of parameters such as speed, braking behaviour, truck model and many more. The exact dependency and influence of different parameters are explained in detail in the following chapter of the simulation as they are used there significantly for a realistic data simulation. Besides the costs, savings also mean to protect the environment: "Neben der wirtschaftlichen Bedeutung für den Spediteur bedeutet verringerter Dieselverbrauch auch aktiven Umweltschutz. Je weniger Diesel der Motor verbraucht, desto weniger CO2 erzeugt er. Ein Liter gesparter Dieselkraftstoff entspricht einer Erleichterung für unsere Umwelt von rund 2,6 kg des Treibhausgases Kohlendioxid CO2." (Hilgers, p. 4, 2016)
# Derived KPI for the project
The following KPIs were determined on the basis of research and the examination of cost factors:
- Fuel consumption
- Main direct cost factor
- Breaking behaviour
- influences consumption
- Road Type
- Influences tires, consumption, speed
- Truck-Route
- Influences incidents, speed, consumption, time, acceleration
- Time
- Estimated Time until arrival
- Real Time until arrival
- Warnings
- Incidents
- Problems with the engine or tires
- Bad or conspicuious driving
# Explore: Ideate and Prototype
The final design of the corporate identity, as well as the design of the dashboard was developed through an iterative process.
# Design Process: Corporate Identity
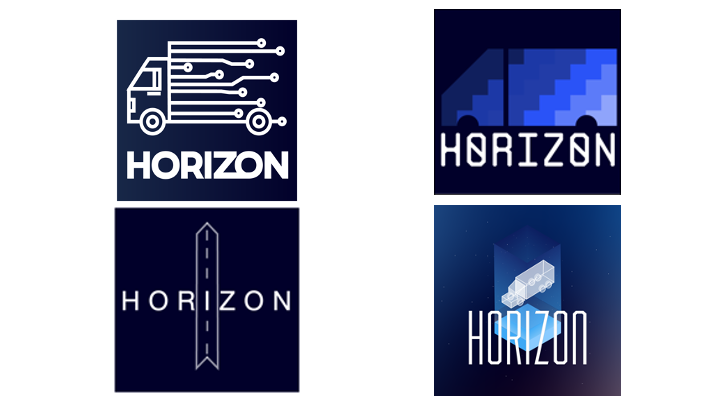
The main idea was to put the truck as the central element in the logo. Also we decieded that the project needs an unique project name, which symbolizes the endless possibilities of the fleet management project. Therefore Horizon was chosen as a metaphor of endless driving. The name also fits the idea of a modern, slightly futuristic design and outcome.
To complete the corporate identity shades of blue were chosen as the main color, wich can be found in the dashboard, presentation, logo and documentation.
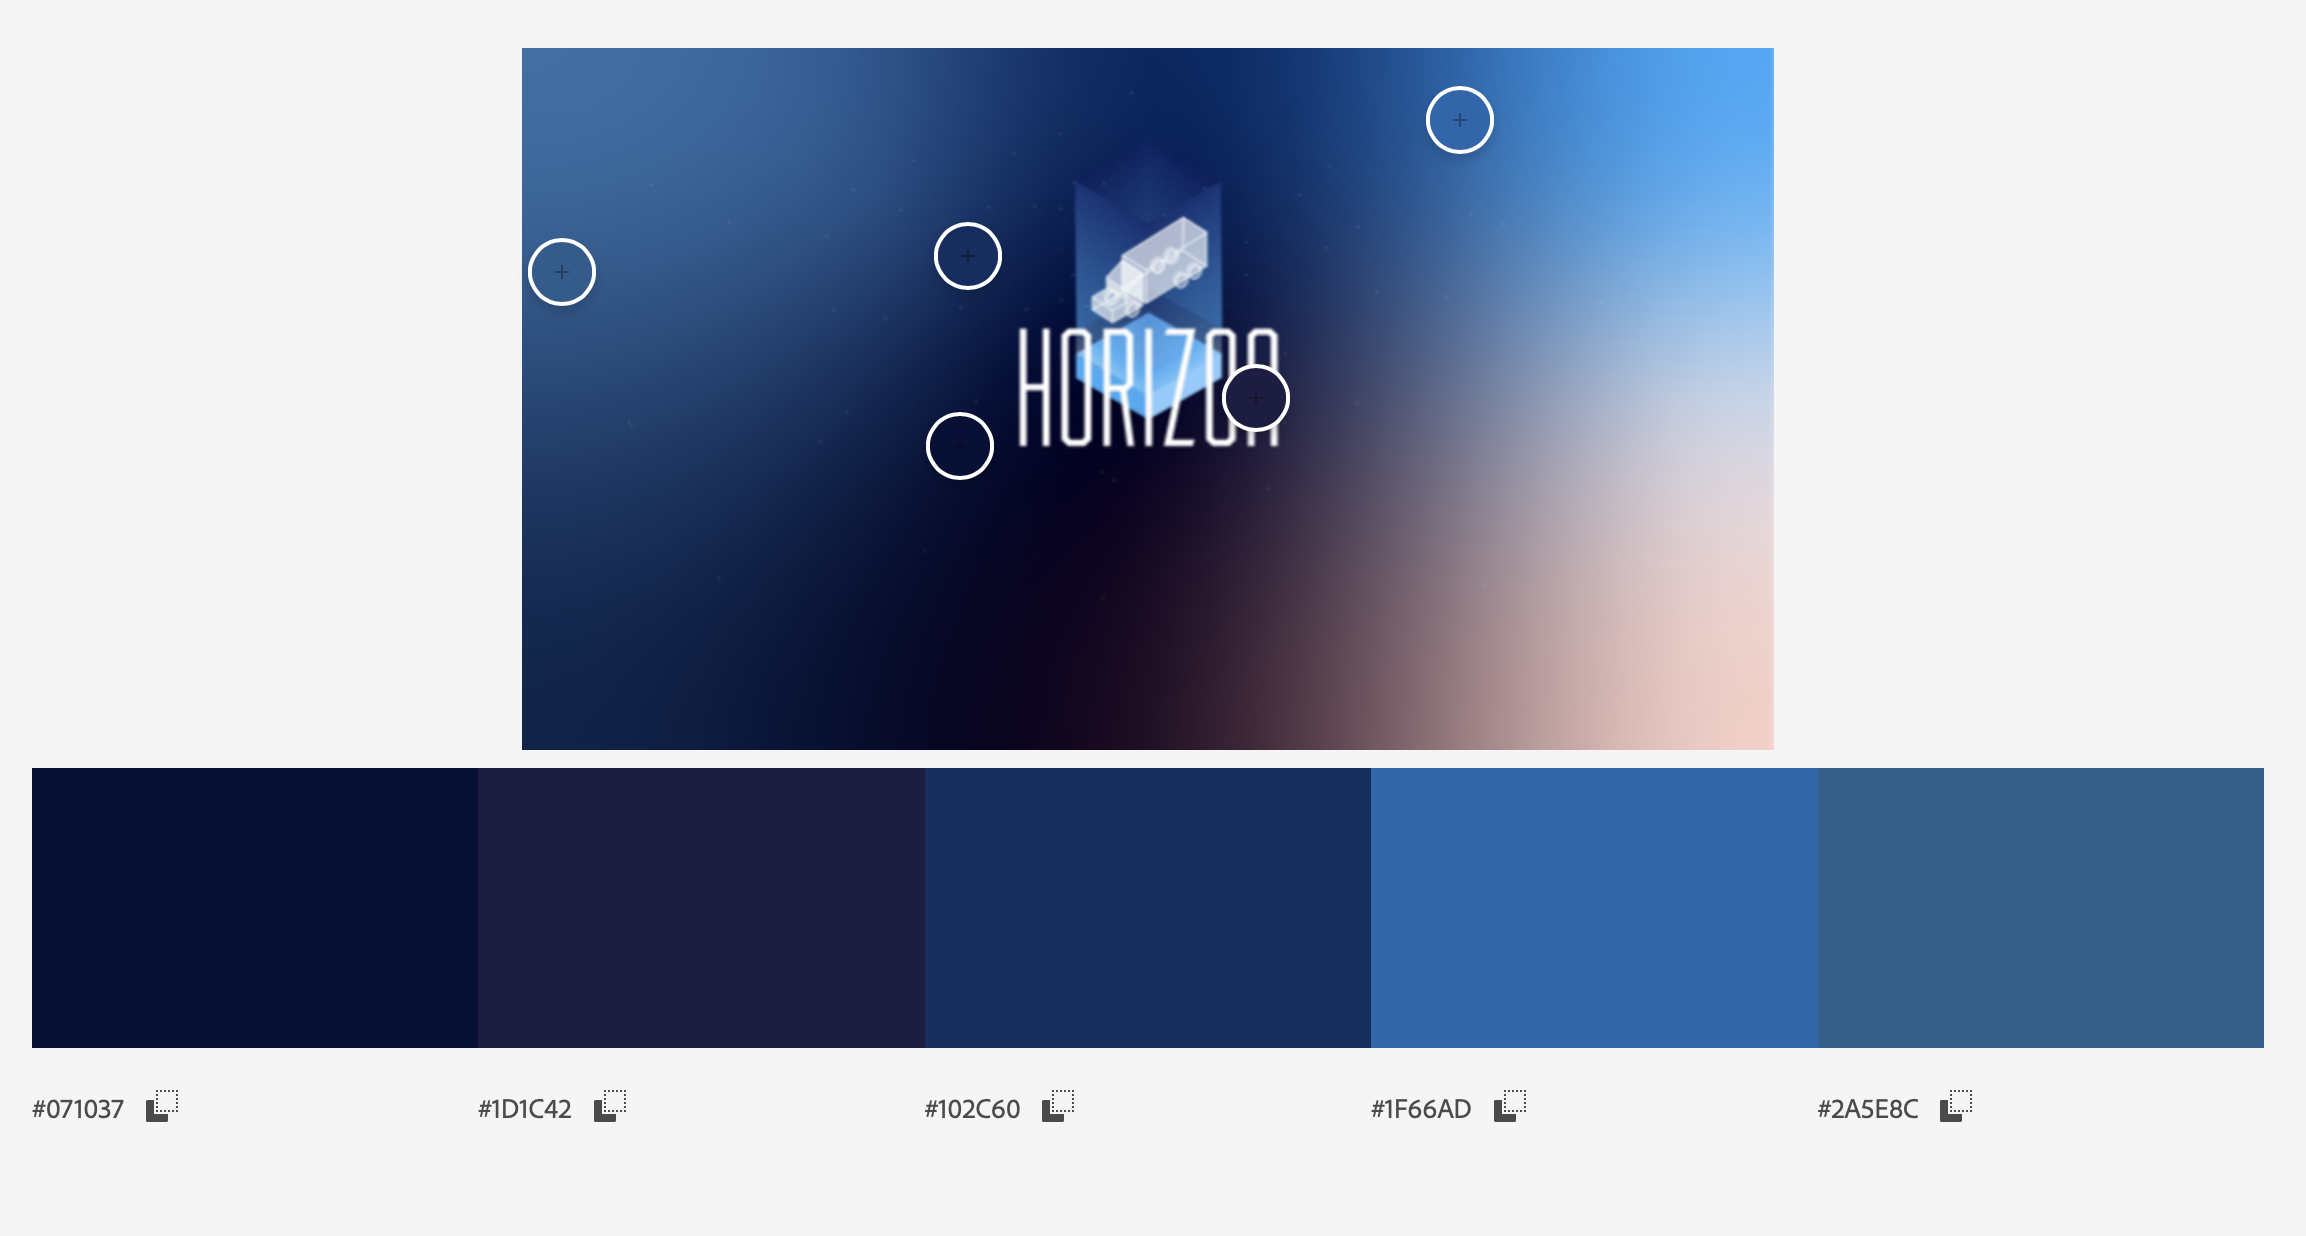
Based on the name and color scheme a logo is designed in an iterative process. Below are all considerations until the final logo on the bottom right.
# Prototype: Dashboard Design
Besides the logo, the dashboard is also design through an iterative process.
First, it was important to put all the information into one interface and evaluation the outcome with the scope (Personas, KPI) of the project.
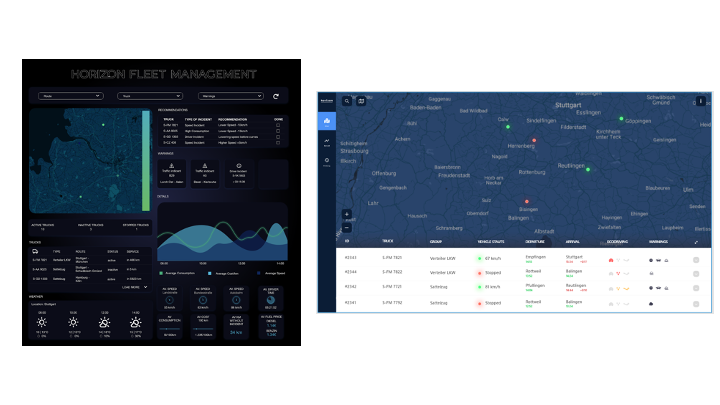
The left approach is way too loaded and complex. A fleet manager needs a quick, clean interface from which he can read off the most important values without searching or distraction. Also it is way to dark, which quickly leds to the decision of a light colored dashboard with blue highlights. The right approach is better but the dominant map repress the KPIs below. Also the Map of Germany is more vertical then horizontal which is not highlighted by the design.
Between the first two approaches and the third final dashboard design approach, many little adaptions and rough sketches (Powerpoint, Pen & Paper, Adobe XD) helped to finalize the design. Below is an impression of the intermediate step:
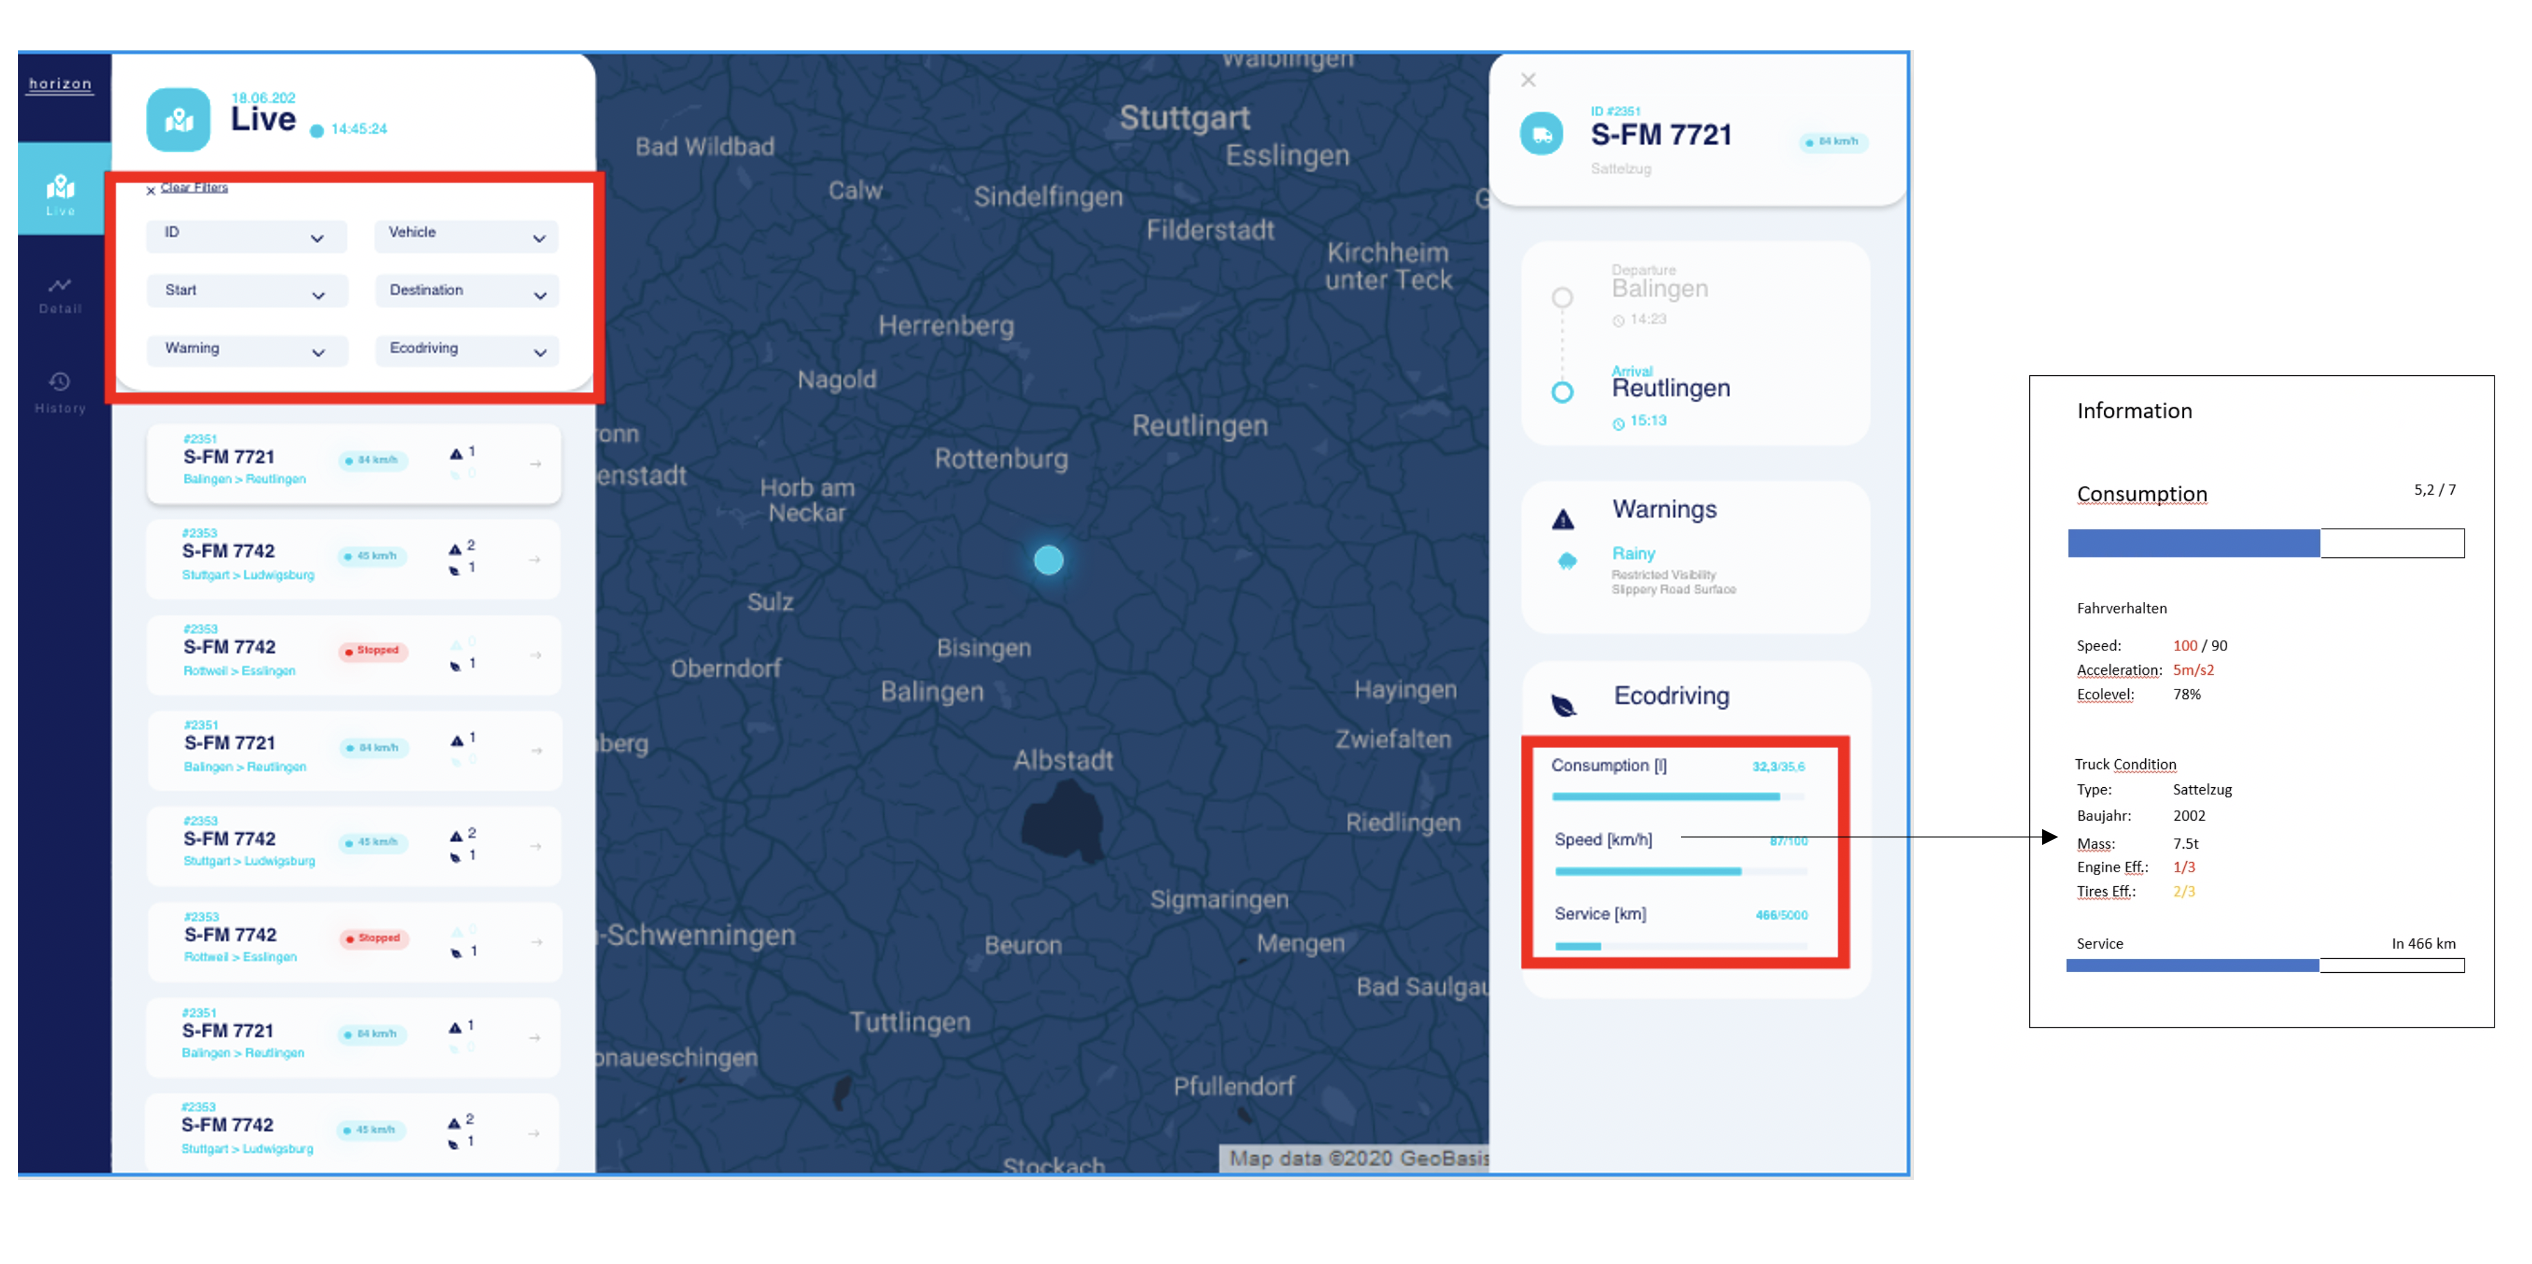
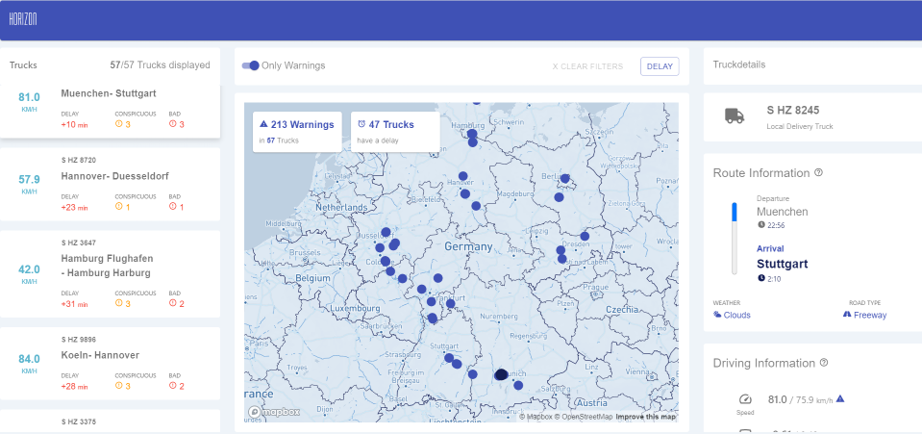
The third design was the final outcome and reflects the need of the fleet manager (who loves having an overview, is analytic and hates chaos) with a clean and light design, displaying an overview with a map and truck list but allowing to go deeper with adjustment options and detail lists. More about the dashboard process can be found in the section "Frontend".
# Test and Implement
The last two design thinking steps can be found in the Frontend section.
# Contributors
Anja Stütz and Sebastian Hermann were mainly involved in Design Thinking and developing a Corporate Identity.