# Frontend
This is the official documentation of the frontend of Horizon. The interactive app visualizes live recommendations for fleet managers and truck drivers.
# Getting Started
The app was created using React.js. React.js is a Javascript library to create user interfaces. To start the app locally you need node.js and npm. Node.js is the platform needed for the React.js development.
| Step | Description |
|---|---|
| 0 | Install the latest stable version of node.js. |
NOTE: The latest version of node.js includes npm already. Therefore, npm does not need to be installed separately.
To run the app on the local machine, navigate to the folder Frontend in the console. Here, execute the command npm start. A browser window should open automatically after a short time and show the application on localhost:3000. If not, open a browser window and enter the address localhost:3000.
| Step | Description |
|---|---|
| 1 | In the console, navigate to the folder Frontend |
| 2 | In Frontend, execute the command npm start |
At this point you should be able to see the running application.
# General Principles
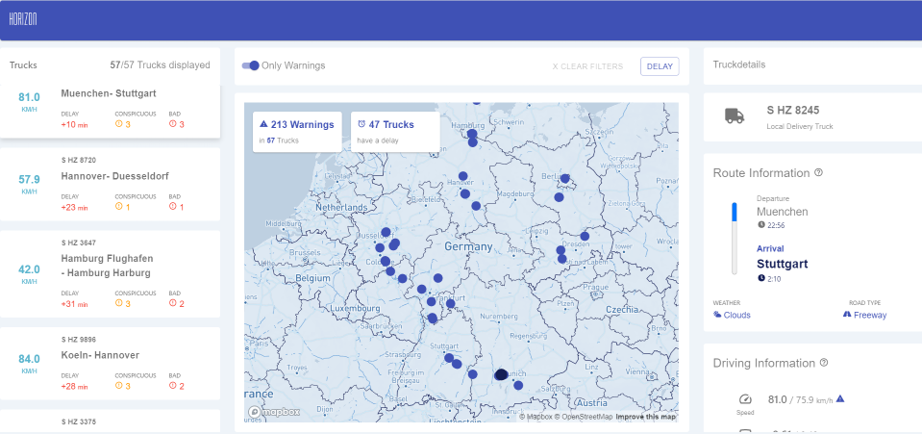
The guideline for the creation of the application was to translate the complex calculations of the backend to live recommendations for action for the target groups truck drivers and fleet managers. Accordingly, the application focuses on the presentation of live data.
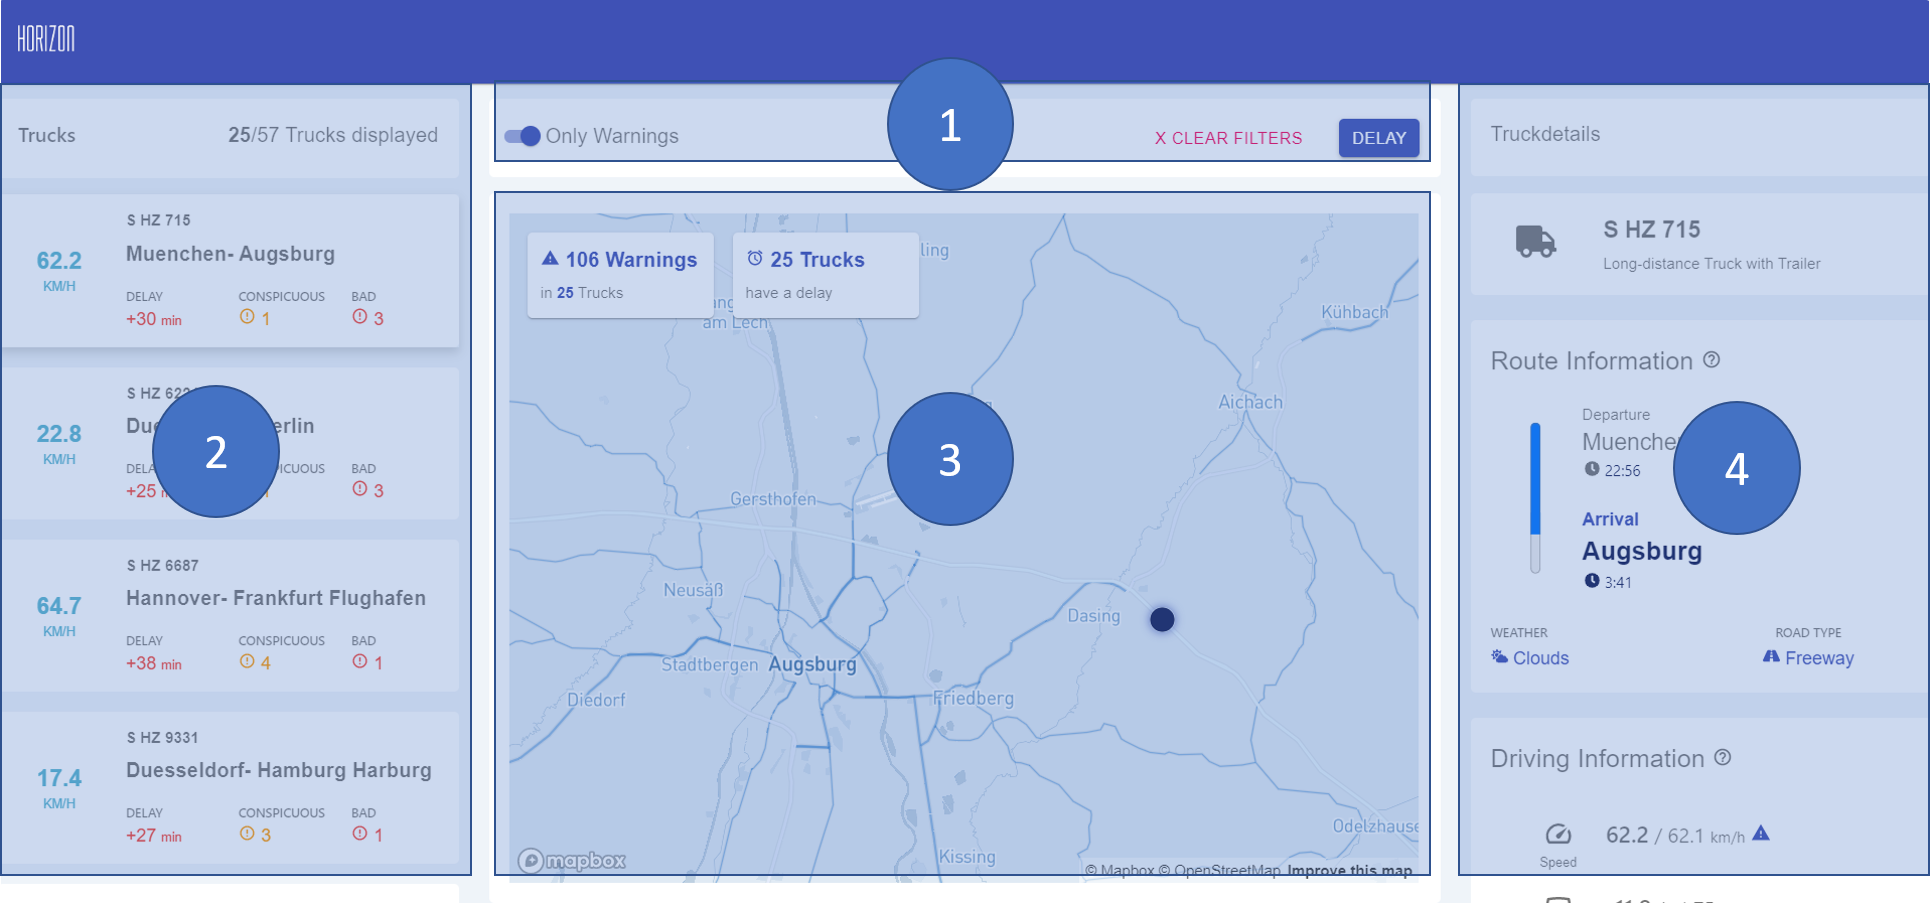
The application can be divided into four areas: the filter bar (1), the list of currently driving truck (2), the map overview (3) and the detail view (4) for a selected truck. The four areas are presented below.
# Filter Bar
The filter bar is used to limit the view of the trucks according to various criteria. This gives the fleet manager a faster overview of all trucks and at the same time allows him to view critical trucks more quickly.
The current version allows two filter criteria: the restriction of the delay range and a switch to filter only those trucks that show anomalies, warnings or urgent messages.
# List of Currently Driving Trucks
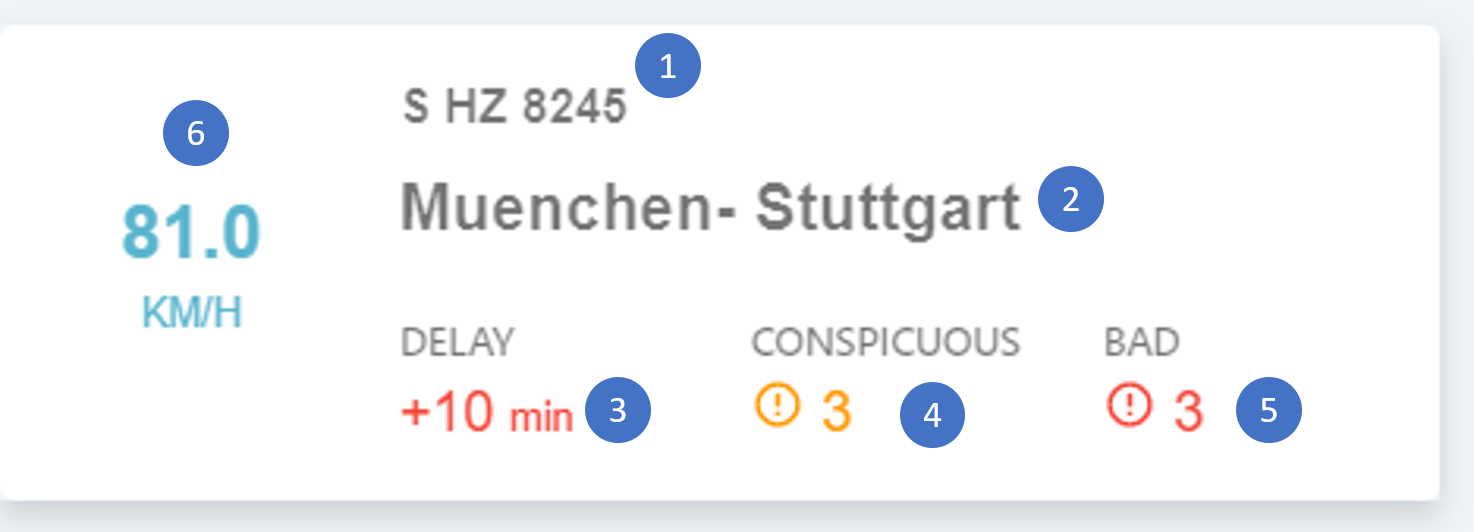
This overview lists all trucks that match the filter criteria. All information that might be of particular interest to the fleet manager at first glance is displayed. The following graphic shows the structure of an individual truck card.
| Nr. | Description |
|---|---|
| 1 | Number plate of the respective truck |
| 2 | Route from start to destination |
| 3 | The amount of delay in minutes |
| 4 | The amount of conspicuous warnings in the truck (more in Detail View) |
| 5 | The amount of bad warnings in the truck (more in Detail View) |
| 6 | The speed of the respective truck |
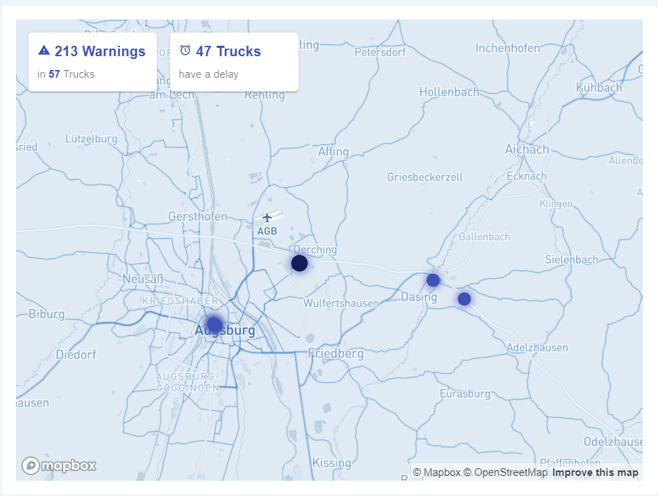
# Map Overview
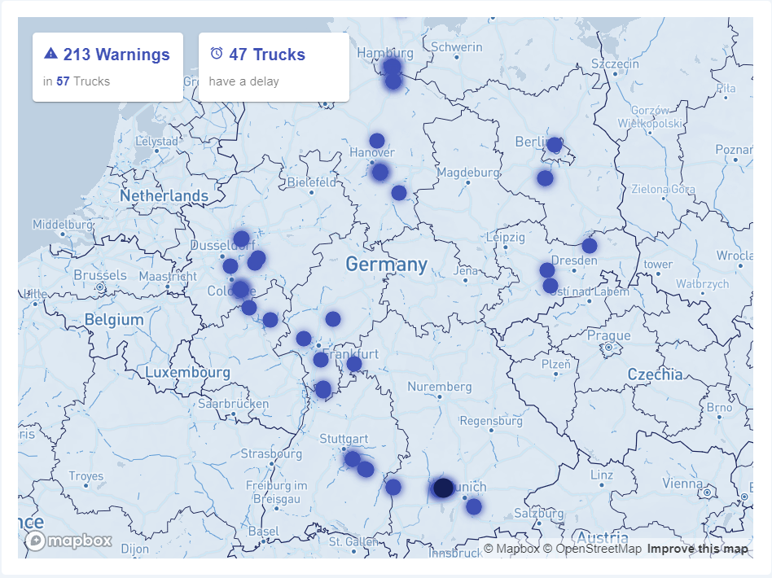
The map overview shows the location of all trucks that match the filter criteria on a map. The Mapbox API is used to display the interactive map. Mapbox is an open source mapping platform for custom designed maps (more information on https://www.mapbox.com). The individual points on the map represent the locations of the different trucks. In the upper left area, two KPI cards are positioned, which give information about the number of delays and warnings (both conspicuous and bad).
# Detail View
In the detail view, several details of a selected truck are displayed. On the one hand, general information on the route and the truck is displayed here. On the other hand, concrete recommendations for various warnings that are already indicated in the list view are displayed in this area.
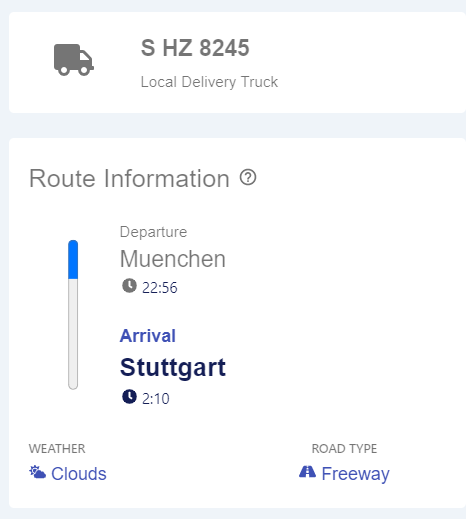
# Route Information
The first card shows the selected truck with its departure time and place, planned arrival time and place as well as the current weather and the type of road. The weather information serves to avert the imminent dangers associated with slipperiness, wetness or restricted visibility as early as possible. The road information helps to better understand the driving behaviour based on the different types of road, as motorways, for example, have different characteristics than country roads.
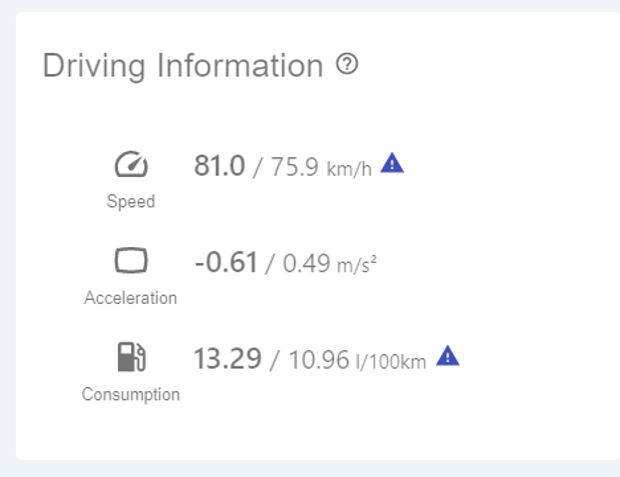
# Driving Information
On the second card, three pieces of information about the current trip are displayed: Speed, acceleration and consumption. All three pieces of information are compared to average values calculated for the respective route in the speed layer of the backend (for more information see chapter Backend and Architecture). If the current value is higher than the average value of the route, a warning symbol for the corresponding value is displayed.
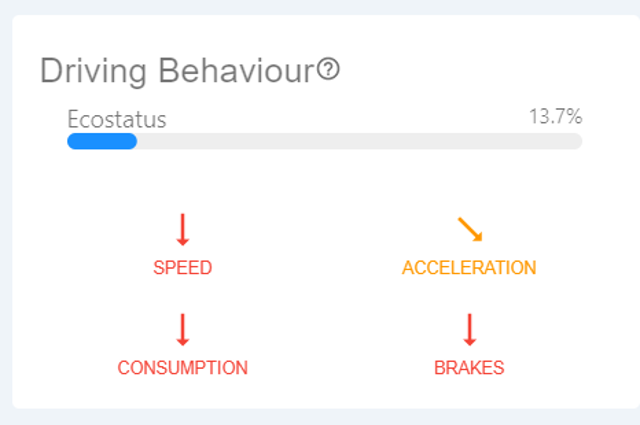
# Driving Behaviour
The third card shows the truck driver's driving behaviour, from which recommendations for action can be derived directly. At the top, centrally positioned, there is a bar chart showing the KPI Eco Status. Eco Status is a key figure calculated from several factors such as speed, acceleration, etc. which indicates the driving behaviour of the truck driver. The closer the value is to 100%, the better the driver drives. An Eco Status of 100% means that the driver shows a very good driving behaviour and therefore drives very efficiently in terms of costs. A value of 0%, on the other hand, implies an urgent adjustment of the driving behaviour. In order to get a detailed idea of what is wrong with the driving behaviour, there are four more illustrations below. These show concrete recommendations for action which the driver must implement in order to achieve a better eco status. There are three categories:
- Normal Behaviour (indicated by dark grey colouring) Arrow points to the right: Behaviour does not have to be adapted.
- Conspicuous Behaviour (indicated by orange coloring) Arrow is tilted down 45°: The driving behaviour should be improved.
- Bad Behaviour (indicated by red colouring) Arrow is tilted downwards by 90°: Driving behaviour urgently needs to be improved.
The colours and classifications have a direct reference to the "Conspicious" or "Bad" counters shown in the truck cards.
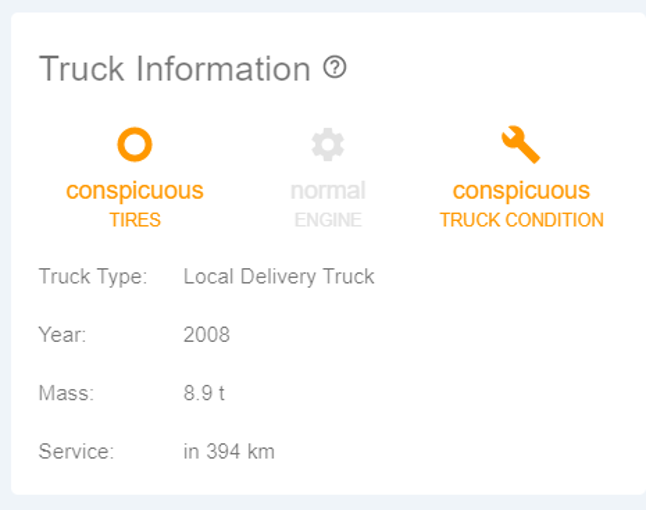
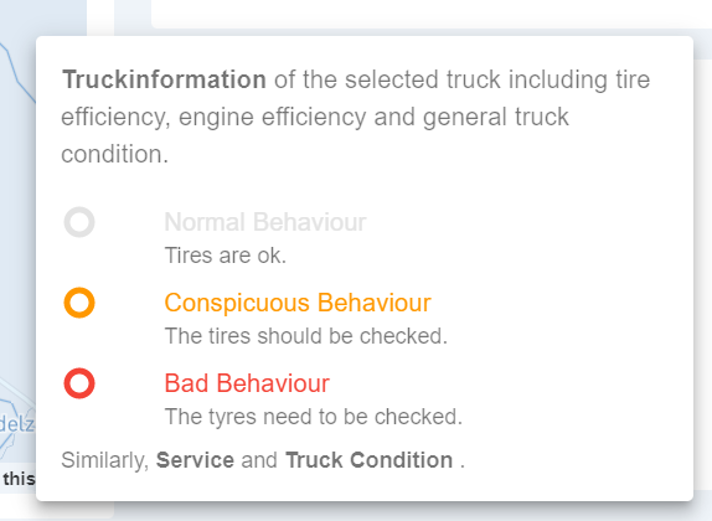
# Truck Information
The fourth card shows general information about the truck. Here again, the warnings are in the foreground. Included are warnings about tire status, engine efficiency and truck condition in general. The gradations are similar to the "Driving Behavior" map. The example of the tire status is given below to illustrate the gradations:
- Normal Behaviour (indicated by dark grey colouring) Tires are ok.
- Conspicuous Behaviour (indicated by orange coloring) The tires should be checked.
- Bad Behaviour (indicated by red colouring) The tyres need to be checked.
Similarly, the factors engine efficiency and general truck condition are graded.
With the information vehicle type, year of manufacture, mass and next service, the fleet manager receives even more detailed information about the truck. This allows him to interpret further conclusions about the driving behaviour (e.g. a truck with a larger mass has a different acceleration behaviour than a truck with a lower mass) or the maintenance susceptibility (e.g. depending on the age of the truck and the next service due).
# Interactivity
The application provides some interactions that help the user to view the desired information as quickly and efficiently as possible.
# Selection of a truck
To select a truck, the user can either click on the map within the list area or select the truck on the map.
# Filter
As already mentioned, it is possible to filter by the criteria delay and warnings. The selection can be reset to the default value by clicking the Clear button. You can filter by delays by selecting a delay interval.
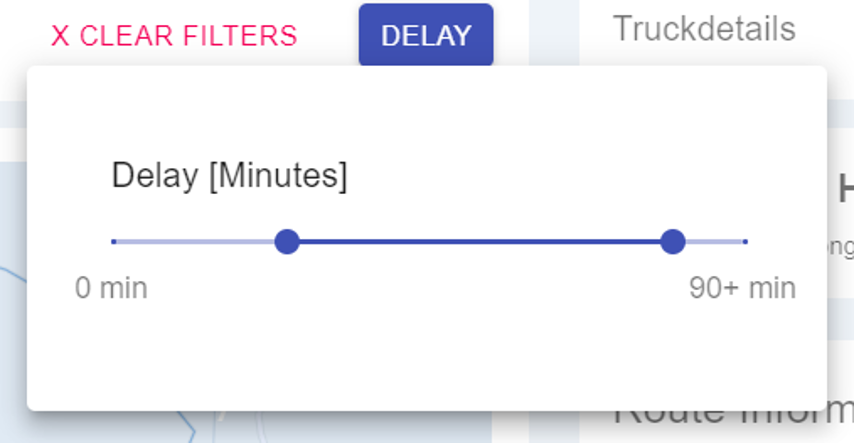
Warnings can be filtered by enabling/disabling the Only Warnings switcher.
# Helper
Within the detailed overview there are helper icons (symbolized as quesion mark icons), which should help the user to get familiar with the application faster. By clicking on the icon, a pop-up window is displayed that explains the elements of the respective card in more detail or shows how the individual symbols and colors are to be interpreted.
# Data Source
The frontend is connected to the backend via a REST API. The application uses an HTTP-GET-Request in intervals of 60 seconds to check whether changes have been made to the data and renders only the components affected by the changes. The JSON (JavaScript Object Notation) data format is used for data exchange, since it supports good readability on the developer side and is independent of the script language on the machine side. Below is an excerpt from the JSON of a truck.
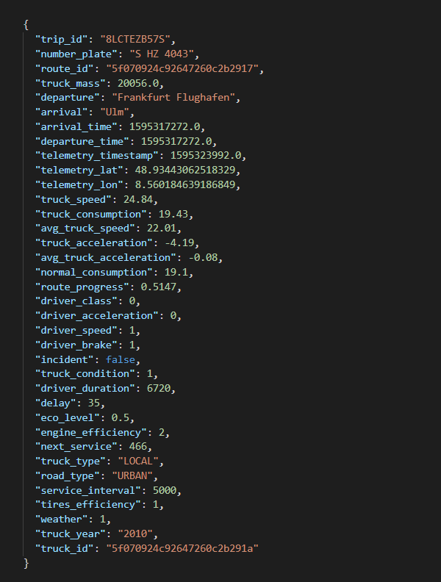
NOTE: For more information about the data and its calculations, visit the Backend and Data Source section.
# Challenges
During the development we were confronted with several challenges. These can be grouped into challenges related to the business case, challenges related to the architecture and last but not least challenges related to the presentation of the data. The most important of these are shown below.
# Business Case
During the development of the application we dealt iteratively with the following questions.
- Which information is relevant for the target groups? Which information has a rather high priority, which a rather low priority?
- Which main benefit should the application offer?
Several wireframes were created during the development process. On the business case level the challenges mentioned so far were evaluated. In addition, the following question was also discussed:
- Is it clearly communicable and plausible for the respective target group?
# Architecture
The architecture of the application is complex, which resulted in immediate challenges for the development.
One challenge was the data connection. Since we only deal with live data, a dummy pipeline had to be created to test the behaviour of the frontend in case of data changes.
In addition, a high degree of data consistency had to be guaranteed, since the target group in particular expects the data from the back end to be displayed in the front end without corruption.
Furthermore, it could be determined that the application in a productive, deployed environment shows fundamental differences to the development environment in data retrieval. Especially the asynchronous queries often led to unexpected race conditions in the deployed state.
Last but not least, a constant exchange between backend and frontend developers was necessary, since even the smallest changes on the backend side could cause the frontend application to stop working. To ensure a certain degree of reliability, a data catalog was created in advance, which defines the name, format and value range of every attribute.
# Presentation
In close coordination with the backend, a lot of data was available which had to be mapped. The structuring and simultaneous translation of the data into user-friendly information proved to be a challenge. Thus, it had to be differentiated which information was relevant at first glance and which could be categorized as details. Furthermore, a certain degree of liveliness of the information had to be introduced. Thus, the application should not only provide information and recommendations for action on the various trucks, but should also be fun to use.
But also the development of the interactions, in particular the development of the filters, presented a challenge. The selection of a truck, as well as the change of the data in the background had a direct effect on all related components. For example, when a truck is selected in the list of currently driving trucks, it must be ensured that it is both highlighted on the map and its details are displayed in the detail view. At the same time it had to be intercepted that the selection of the truck crashes when the data in the background is changed.
# Contributors
Anja Stütz and Sebastian Hermann were mainly involved in the development of the frontend.